reports:performance_summary_report
This is an old revision of the document!
Performance Summary Report
| Based on the selected KPIs the performance summary report measures the performance on corporate level. Due to easier comparison the report contains values from previous periods. This way you can easily evaluate if your employees performance increased or decreased. The overall, group and individual score calculations are based on the KPI's weight. |
|---|
Report Configuration
After the general configuration (see more about the general configuration fields here ) you will see a report specific field:

- If you have task groups for special purpose what you don't want to see in the report, you can exclude them by starting enter their name or select from the dropdown menu when click on the field.
- Select this if you want to get the xlsm file in e-mail. In general you only get the HTML view.
- You can make hierarchy between users and groups, starting from the company level. If you need hierarchy specific information, you can customize this here. You have to set 2 level separated by comma (like in the example). For more informations about he user and group levels visit the user management page
- Here you can set the details of the report's HTML view:
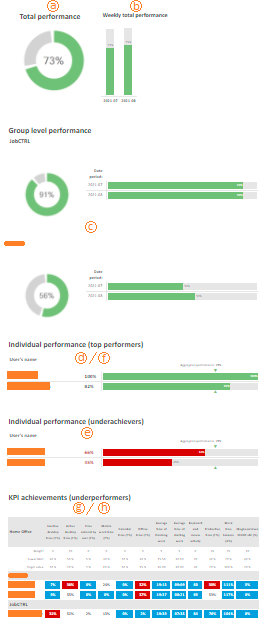
- The total performance indicator measures the norm of the selected people from the whole period.
- The total performance in weekly breakdown.
- The total and weekly performance of the selected groups.
- Best 3 performance (Overall).
- Worts 3 performance (Overall).
- Overall individual performance. Note that you can only select The overall or the best/worst performances.
- Option d., e. and f. is compared to the overall aggregated performance even if option a. isn't selected.
- The spreadsheet shows only the worst 3 underperformer.
- The spreadsheet shows all user in a group breakdown.
- The sheet in option g. or h. provides information about the selected KPI weights, the limits what someone shouldn't cross and the target values.
- You can select any KPI from the available list by start typing the name of the KPI or select them from the dropdown menu by clicking on the icon at the end of the field. If you don't select any, the followings will be presented in the report:
- Inactive desktop time (Σ%)
- Active desktop time (Σ%)
- Time entered by user (Σ%)
- Mobile work time (Σ%)
- Calendar time (Σ%)
- Offline time (Σ%)
- Average time of finishing work
- Average time of starting work
- Keyboard and mouse activity
- Productive time (Σ%)
- Work time balance (Δ%)

reports/performance_summary_report.1614345227.txt.gz · Last modified: 2021/02/26 13:13 by support